

May 2026 - War? What War?
The market just declared the Iran war over. WTI says otherwise. Here's how I'm positioning for May.

April was the month the market decided the Iran war did not matter. The S&P 500 closed above 7,200 for the first time in history. The Magnificent Seven posted its best month on record. Risk appetite came back across geographies and asset classes despite no actual ceasefire.
Oil is back above $110. The Fed is more divided than it has been in years, with the hawks pushing for tighter policy. And hyperscalers like Meta and Microsoft may stop buying back their own shares to free up billions in cash for AI spending. Each of these things matters on its own. All three at once is a problem.
What moved last month
April was a V-shaped recovery. The S&P bottomed near 6,400 at the end of March and ripped above 7,200 by month-end. Semiconductors led the rally, with the Magnificent Seven posting its best month on record. China equities were the standout regional performer as their relative insulation from the Iran conflict combined with continued domestic stimulus to attract foreign flows.
WTI crude swung wildly. It topped $115 in the first half of the month before falling close to $80 on the TACO trade I called out in last month’s letter. Then it rallied back above $110 in the final week as the Trump administration extended the Strait of Hormuz blockade.
Core PCE for March printed in line at 3.2%. Not soft enough to confirm the disinflation story. Not hot enough to break it. The Powell-to-Warsh transition on 15 May now becomes the next real catalyst.
How my positioning performed
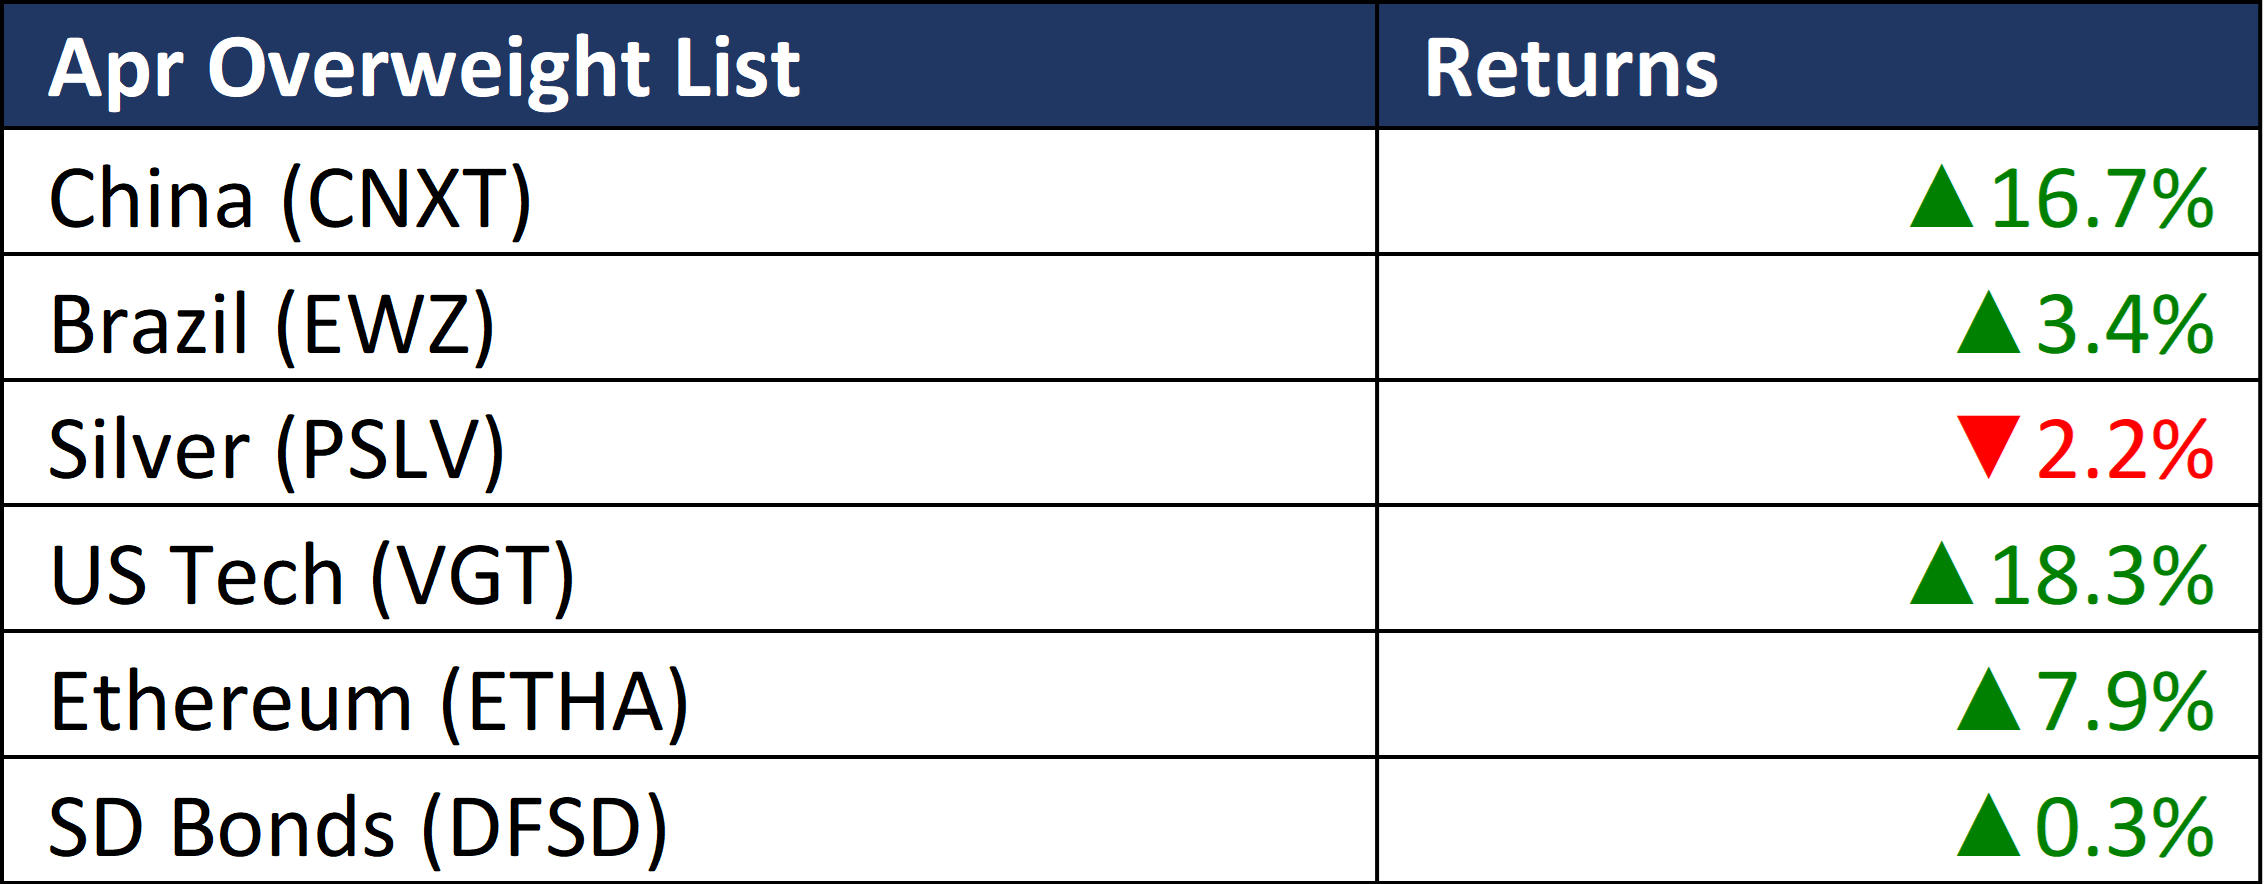
The April rotation worked. US Tech was the standout at 18.3% as the Nasdaq correction gave us the asymmetric entry I was waiting for. China delivered 16.7%, validating the structural call that Chinese assets benefit from Iran insulation and stimulative policy at home. Ethereum gained 7.9% as crypto sentiment recovered from the depressed March levels. Brazil added 3.4% as the commodity-linked diversification leg.
Silver was the lone disappointment at -2.2%. as the lack of rate cut sentiment dampened the relief rally I was looking for.
Short-duration bonds quietly added 0.3%. Not exciting, but exactly the role I want them to play. They gave me the carry and stability that allowed the offensive book to do its work without excessive risk.
What the chart is telling me
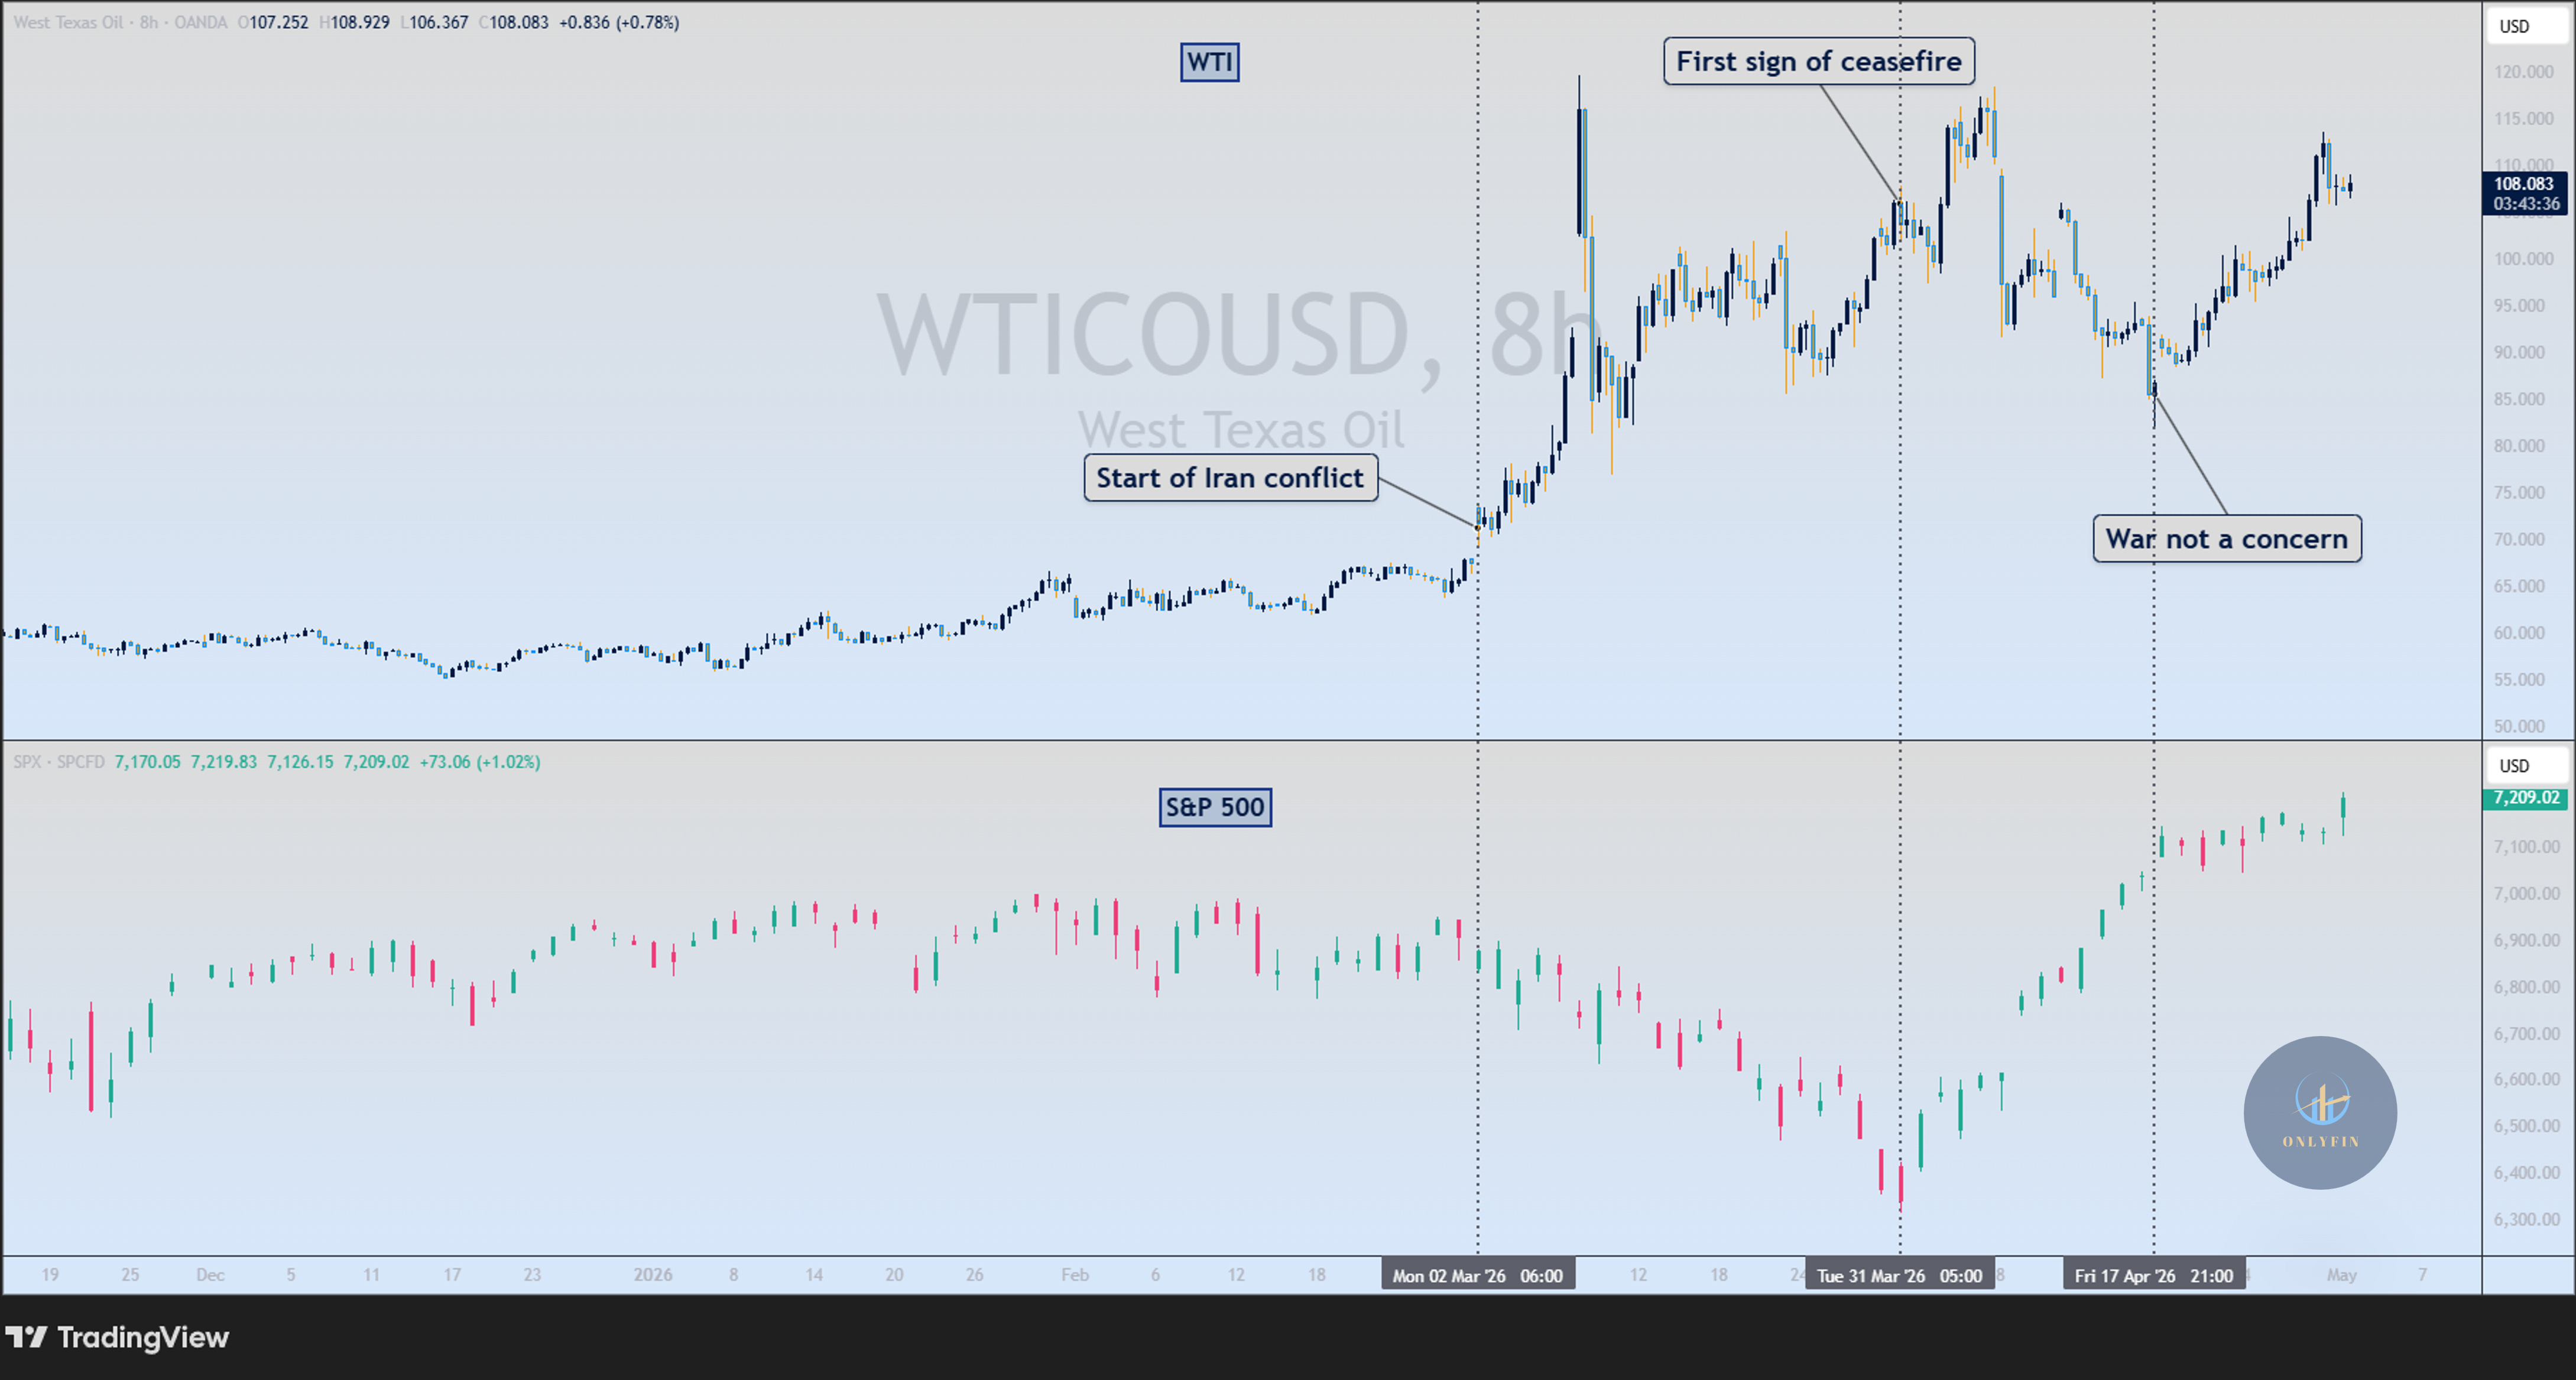
The chart shows WTI crude overlaid with the S&P 500 across the duration of the Iran conflict. The divergence in the second half is what caught my eye.
From early March through the first ceasefire signal at the end of the month, oil and equities moved inversely as expected. Crude rallied past $120 and the S&P fell below 6,400. Then from mid-April onwards, the relationship broke down. The S&P rallied uninterrupted from the lows back to 7,200 even as crude initially fell towards $80 and then reversed back to $110.
The market has effectively priced two ceasefire scenarios that have not happened. The UAE leaving OPEC means it can produce and export freely once Hormuz reopens, signalling more supply over time. Equity markets are pricing the view that the economy can absorb WTI below $120, supported by real-time inflation data from sources like Truflation that have yet to show a significant uptick.
Whether that absorption thesis holds is the question for the rest of the quarter.
Three catalysts I am watching for May
The April rally either becomes a sustained move or it gets unmasked as short covering. Three things will decide it.
The first is whether WTI holds above $120. That is the level where equity markets historically lose the ability to absorb energy costs without margin compression and consumer demand pulling back. Stay below it and the bull case lives.
The second is the US 10-year Treasury yield, currently around 4.40%. Yields set the cost of capital for companies. The Fed’s hawkish dissenters and the Powell-to-Warsh transition on 15 May both raise the probability of a hawkish surprise that pushes yields higher. If the 10-year breaks 4.70%, rate sensitive assets fall.
The third is the most underappreciated. The AI capex cycle is now visibly crowding out corporate buybacks. Meta just raised its 2026 AI capex guidance to $145 billion, with the latest CFO commentary noting AI infrastructure costs will pressure free cash flow. Goldman Sachs has flagged that S&P 500 buybacks have already flatlined this year as capex growth accelerates. Buybacks have been the largest source of equity demand in the post-2020 cycle. If the hyperscaler capex revision to roughly $650 billion forces broader buyback retrenchment, the marginal buyer of US equities disappears precisely when energy and rate pressures are intensifying.
All three risks are real but none of them have hit yet. That is why I am still slightly bullish on equities. But any one of them confirming could cause a quick sell-off, which is why I am tightening risk at the same time.
Where are we in the big picture?
Ray Dalio’s Changing World Order
We are watching Dalio’s thesis play out in real time. America, the world’s current superpower, is at war, overstretching its finances, and facing domestic infighting and instability through the No Kings protests. This is textbook late-cycle behaviour for a declining empire. It doesn’t mean collapse is imminent, but it reinforces why diversification away from US assets and into real assets, emerging markets, and commodities remains the structural play.
Howard Marks’ Pendulum
Sentiment swung from extreme bearishness in March to extreme bullishness through April, with the S&P closing at all-time highs and the Magnificent Seven posting its best month on record. The pendulum is back at the optimistic extreme. That is usually when the asymmetric setups appear on the other side. I am not calling for a crash, but I am taking some chips off the table where the crowd is most positioned, which is concentrated mega-cap tech. The contrarian setups for May are in commodities where speculative positioning is offside, not in the names everyone is chasing.
Peter Lynch’s PEG Bands
US trailing P/E sits at 25.3x, around 1.8 standard deviations above the 10-year mean. That is stretched but not extreme. China is at 9.9x, nearly a full standard deviation below its 10-year mean and still the cheapest major market in the world. The valuation read continues to favour the diversification trade, with US exposure earning its place through earnings momentum rather than valuation, and China earning its place through the opposite.
Elliott Wave
The S&P 500 closing above 7,200 for the first time in history confirms the impulse wave structure remains intact. WTI is in a corrective wave but the structural setup above $100 holds. The two charts I am watching most closely are the 10-year Treasury yield, which would break a multi-year corrective pattern if it pushes through 4.70%, and the broad US dollar, where the structure suggests further weakness ahead.
The April rotation worked because of the specific moves and weightings I am about to walk through. The rest of this article covers what I am doing for May.
Paid subscribers get the full positioning each month, plus every trade call I take in real time on the private Telegram channel. The S&P long closed +6.5%. The silver long closed +6.25%.
What I am doing this month
Keep reading with a 7-day free trial
Subscribe to OnlyFin to keep reading this post and get 7 days of free access to the full post archives.